Lately, I read a paper about profiling with AspectJ: it investigates how to profile heap usage, object lifetime, wasted time and time spent. I was wondering how difficult it would be to write my own simple profiler; and as we’ll see it’s easy and fun.
If you’d like to check out the sample code that accompanies this post, you can download the Eclipse project as tar.gz or zip; make sure to install the AspectJ Development Tools. You can browse the code online here.
How to profile methods
Writing an aspect that adds advice to the methods you’d like to profile is as easy as this. You define a pointcut that matches the methods you’d like to monitor and define an around advice that calculates the time it took the method to execute. Have a look at the following piece of code:
@Around("profile()") public void aroundInterestingMethods(ProceedingJoinPoint thisJoinPoint) throws Throwable { final long start, end; start = System.nanoTime(); thisJoinPoint.proceed(); end = System.nanoTime(); // calculate time: (end - start) / 1000) / 1000; } |
All that’s left to do is to define a pointcut named profile, that matches the methods you’d like to monitor. Since the pointcut will be variable, I wrote an abstract aspect that can be subclassed for different monitoring needs.
In a subclass you would implement the profile method like so, if you’d like to monitor all methods named run:
@Pointcut("execution(* *.*.run())") protected void profile() {} |
What about the results?
If you would run the sample code, you could see this:
    Results for Runner.run (1002ms)
    Method: TaskB.run() took 600ms (60.0%)
    Method: TaskA.run() took 400ms (40.0%)
Once the run method of the Runner class comes to an end, we can see these statistics, produced by the afterTopLevelMethod method from the profiling aspect.
Based on this textual results it would be pretty easy to produce a graphical representation with gnuplot or JFreeChart. I could imagine a picture like this:
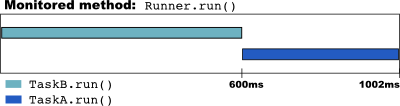
Although this looks very simple, a picture might be easier to absorb if there would be more methods.
Conclusion
As we’ve seen, profiling with AspectJ can be implemented straight forward. My simple example showed how to monitor certain methods and calculate the their execution time. The authors of this paper point us to some more things we might want to profile, e.g. heap space. Although I haven’t tried it yet, it should be possible to implement this too.
Do you have the paper? Can you share it for me to read. I would greatly appreciate it. Thanks.
Hey i am also looking for the paper, if u can give source for that it will be good
thanks,
Vijay
Hi Vijay,
you can download the paper here.
Attempting to leverage this code. I never see the profile() fire, however. I do see the AbstractProfilingAspect constructor fire once I subclass Runner/TaskA/TaskB from RunnerProfilingAspect – but no actual aspect processing…
Are the files here missing something? Or, more likely, I am. Any ideas?
I initially tried making my own eclipse project off your source… By loading up your project, I see a different notification (advice defined in org.christianschenk.aspectj.profiling.AbstractProfilingAspect has not been applied [Xlint:adviceDidNotMatch])
Thanks.
Hi howie,
unfortunately, I don’t know the latest ins and outs of how to match a certain advice. Please check out the most recent documentation for AspectJ and I’m pretty sure they just changed the format. Please keep in mind that this post is almost five years old and hasn’t been updated since.
Understood. Was just hoping for just being missing something. Thanks for the reply, though.
BTW, when you say “If you would run the sample code”, do you mean run the JUnit RunnerTest? I dont see any of profiling stuff executing when I do that!
Dear Pankaj,
that’s correct. Simply run this JUnit class and you should see the output that I mentioned. If nothing happens it’s likely that you haven’t set up AspectJ correctly or the version I used back then isn’t compatible with the one you’re using now and the code would need a few adjustments. As I said to Howie, please check out the most recent documentation for AspectJ in any way.