Apple’s Xcode comes with a neat profiling tool called CPU Sampler. It helps you identifying time consuming code blocks in your software and is really handy if you need to optimize for optimal performance.
Just recently I tried rewriting OpenGL’s routines that handle matrix calculations as part of a lecture at the university. Pretty soon I came to the conclusion, that I had to optimize my code if I wanted to compete with the implementation provided by OpenGL.
This post presents at quick look at CPU Sampler which helped me making well-founded decisions resulting in a faster implementation.
Howto
Once you’ve developed your software with Xcode and want to profile it using CPU Sampler, all you have to do is to click on Run – Run with Performance Tool – CPU Sampler. This will start the tool and run your application; you can start and stop the recording as you see fit.
As soon as you end your application you can have a look at the samples collected during the last run. This is the interesting part because you can review how long a certain function was running and the percentage tells you how long this took compared to the overall run.
Try playing around with the various options. In most situations you can stick with the defaults but there’re more interesting things to look at if you want to. For example try changing the Active thread from All threads to something else and the view will show the corresponding samples only.
Example
As I said, I tried rewriting OpenGL’s routines that handle matrix calculations. This was meant as an exercise to understand the operations needed that changed the matrices. Of course, the implementation was way slower than OpenGL and I should try speeding it up.
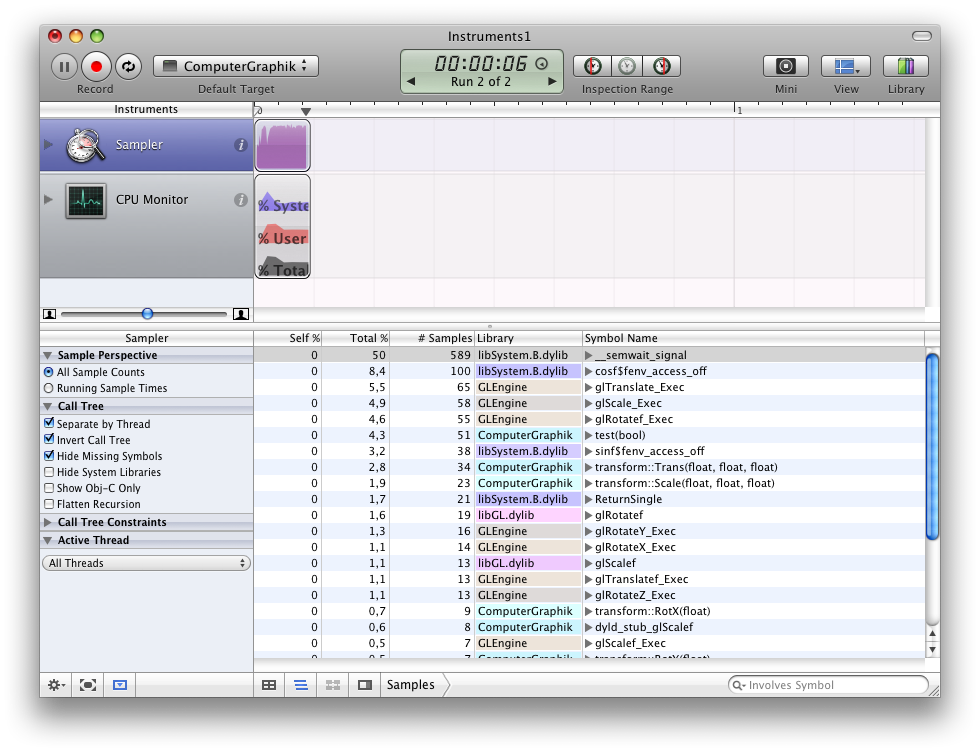
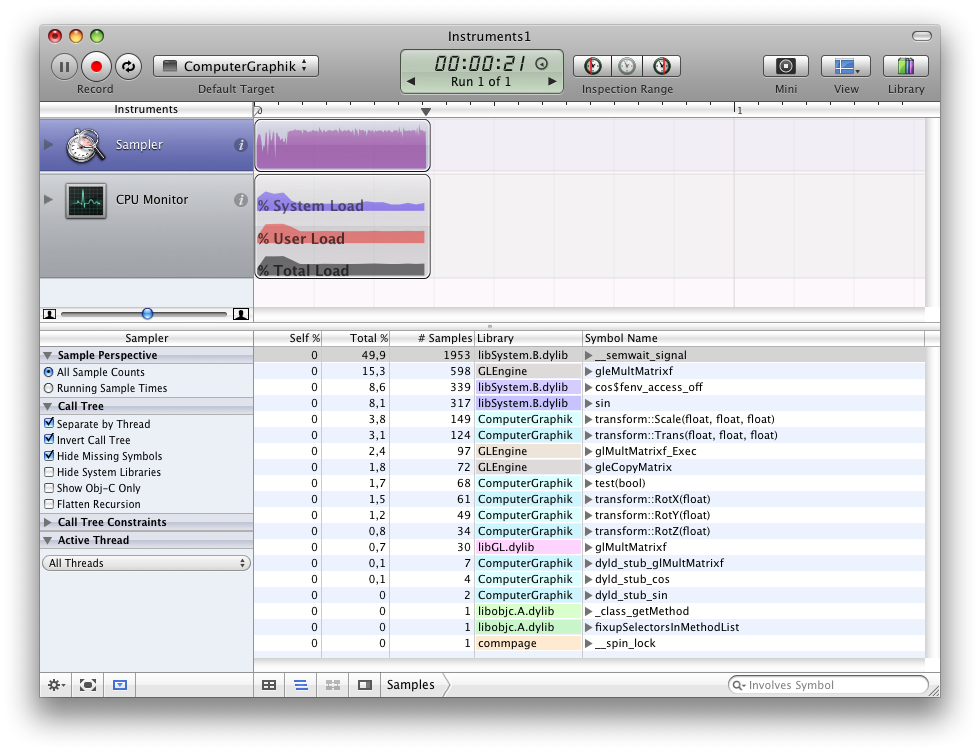
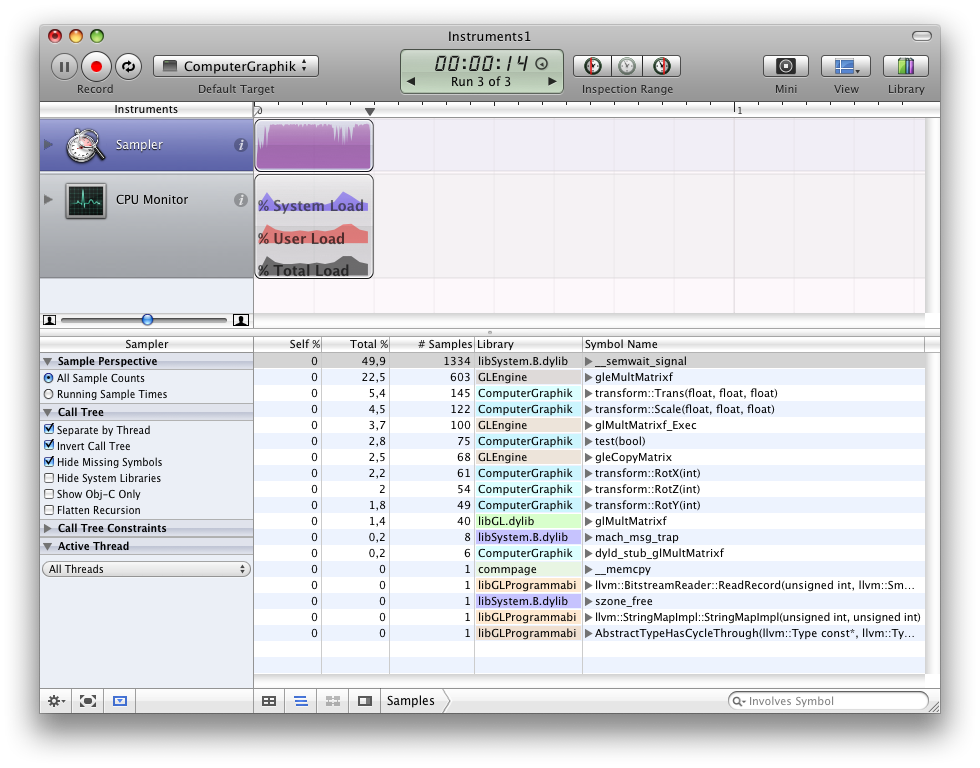
Using CPU Sampler I immediately identified a bottleneck and a major difference between my implementation and the one that comes with OpenGL. The slow part of my code could be found in repeated calls to cos and sin. Since OpenGL seems to work with the libraries of my graphics card directly I guess it tries to do certain computations there.
What I now did was substituting the calls to cos and sin with code that used a lookup table to retrieve precalculated values. This resulted in a major performance boost – still, OpenGL’s code is twice as fast as my one.
Have a look at the following screenshots. They show a run using OpenGL’s implementation of matrix manipulations, my own and an optimized version of my own implementation. Comparing the naive and optimized version of my code clearly shows that the optimized variant doesn’t spent much time calculating cos and sin.
Conclusion
I wanted to show that using a profiling tool like CPU Sampler that comes with Apple’s Xcode may make your life much easier if you’re trying to optimize your application. This helps you to make wise decisions when it comes to optimizing code so you don’t have to obfuscate your software with hard to read code blocks that have a very little effect regarding performance.
It’s nice to see that Apple ships tools like this with its IDE. Have a look at the other performance tools and you’ll be amazed how many cools things Xcode is capable of – things you wouldn’t even dream about in other IDE’s.